litek8s ui: the dev environment in a terminal
litek8s ui is litek8s’s answer to OrbStack’s and Docker Desktop’s windows:
see, configure and operate the local dev environment without remembering
commands. It is part of the same binary, keyboard-driven, fits an 80x24
terminal, and works the same locally and over SSH:
litek8s ui # this machine's dev clusterslitek8s ui --cluster ci # starting on the local cluster `ci`ssh -t box litek8s ui # another machine's, in your terminalNine views, 1-9 (or tab) to switch, and a tenth, 0, on clusters
that run Argo CD or litecd; ? for the keys of each:
| view | what it gives you |
|---|---|
| 1 Home | the shown cluster’s state (up, down, starting, stopping), mode, uptime; its CPU, memory and disk against what the VM or rootless sandbox has; in a box of its own, the Docker socket’s containers, images and volumes and what they take; the API server; whether docker and kubectl point at it. u up, d down, R delete (asks first) |
| 2 Clusters | the local clusters (state, API port, nodes, memory, age) and your kubeconfig’s other contexts; n new (name, nodes), u/d up/down, D delete, enter shows it in every view (and offers to point kubectl and docker at it); see Clusters |
| 3 Containers | docker ps -a, grouped by compose project, with each project’s memory against its budget, CPUs and OOM kills: l logs (follow), s a shell in the container, u/x/r start/stop/restart, d remove; on a project row they act on the whole project, space folds it |
| 4 Images | sizes, age, which containers and pods use each; d remove |
| 5 Volumes | sizes, which containers mount each, compose project; d remove |
| 6 Free space | what can be reclaimed: stopped containers, dangling images, build cache, unused images, unused volumes; select with space, p frees it |
| 7 Kubernetes | a cluster UI for any cluster or context (litek8s, k3s, EKS, GKE, …), k9s-style: : any resource (CRDs too), / filters and selectors, describe, YAML, edit with a server dry run and a diff, logs of pods and whole workloads, shells, port-forwards, xray trees; see Kubernetes |
| 8 Settings | CPUs, memory, the VM’s disk (grows in place), shared directories, API port, where published ports listen; switch the docker and kubectl contexts to litek8s and back; edit the settings file in $EDITOR |
| 9 Observe | the cluster’s alerts and its pods by CPU or memory with sparklines of the last 30 minutes, from the API server’s built-in metrics; every log of a pod (gone containers included), a regex search of every pod’s logs, acknowledge alerts; see Observe and observability.md |
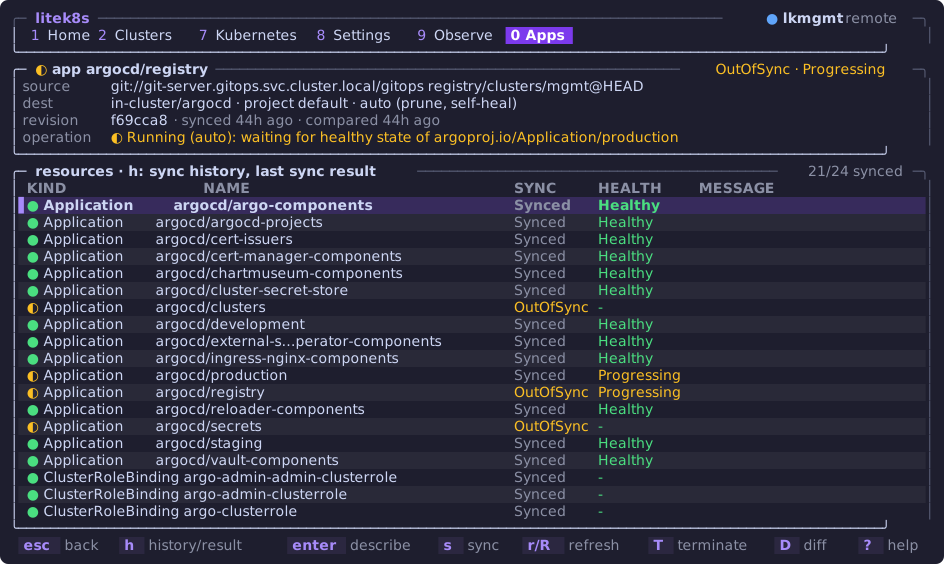
| 0 Apps | only where the cluster serves applications.argoproj.io: Argo CD’s Applications (run by Argo CD or by litecd) with sync, health, revision, last sync and what the operation says; one app’s resources, sync history and last result; sync (with prune, and force on Argo CD), refresh, hard refresh, terminate a sync (Argo CD); see Apps |
Everything that deletes or stops asks first, and says what goes: removing a compose project lists its containers, deleting a cluster says it deletes every object, image and volume and where they are, freeing space adds up what it frees.
The UI is drawn in the spirit of btop:
rounded boxes with their titles set into the border, a header with the tabs
and the shown cluster’s badge (state, mode, uptime), meters that go from
green through yellow to red with eighth-of-a-cell precision, history graphs
for CPU and memory, breakdowns as inline bars, and the same status glyphs
everywhere: ● running, ◐ pending or starting, ✕ failed or crashing,
○ completed or exited. Lists have bold headers, dim secondary text, rows
colored by state (plain while fine, yellow on the way, red when failing,
dim when done) and, when the terminal says what its background is, a
subtle zebra; the footer’s keys are chips. The accent is litek8s’s violet.
Before and after, on the Mac with the same cluster (--cpus 4 --memory 4096, a 3-replica deployment, a CPU-burning one, a crash-looping pod, a
pending one, a finished job, a compose project), in a dark terminal:
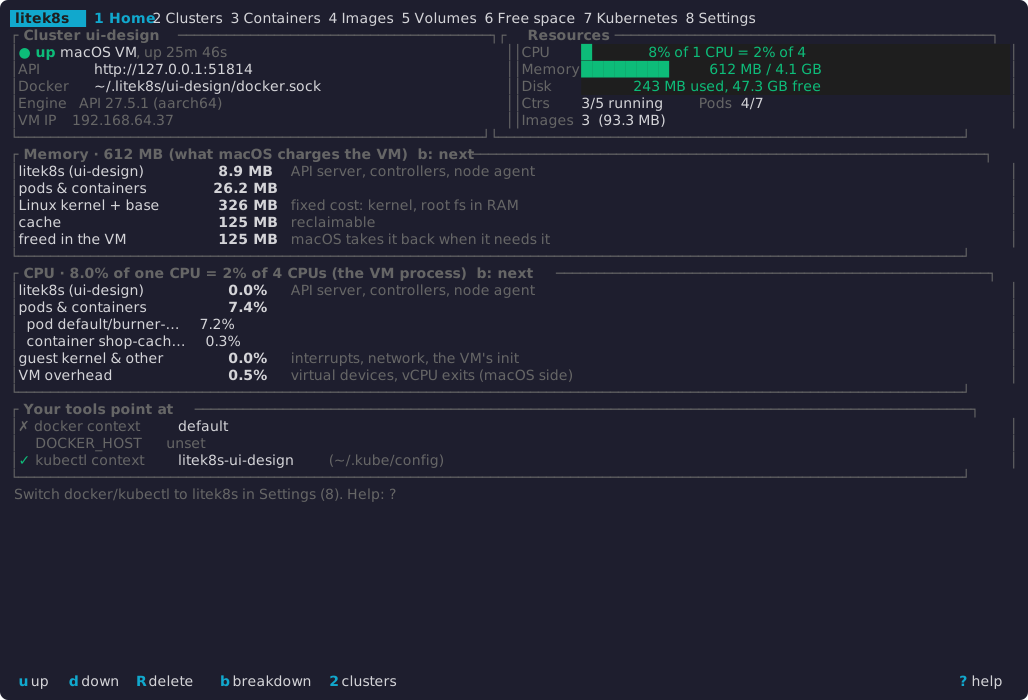
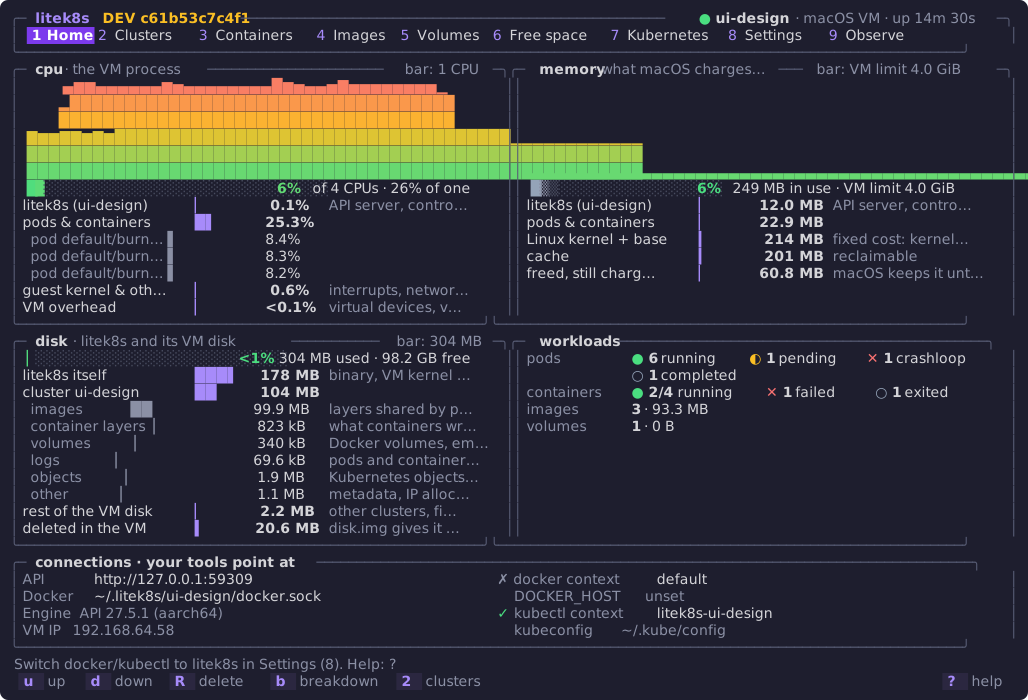
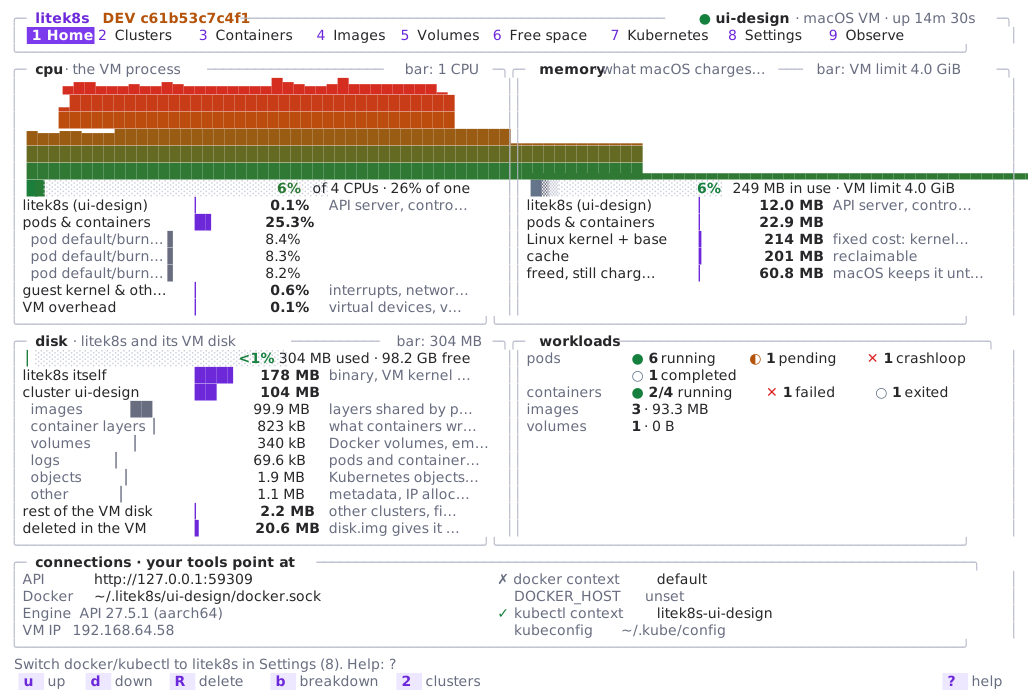
The same in a light terminal, and the Kubernetes view (dark, with the zebra rows the terminal’s reported background allows):
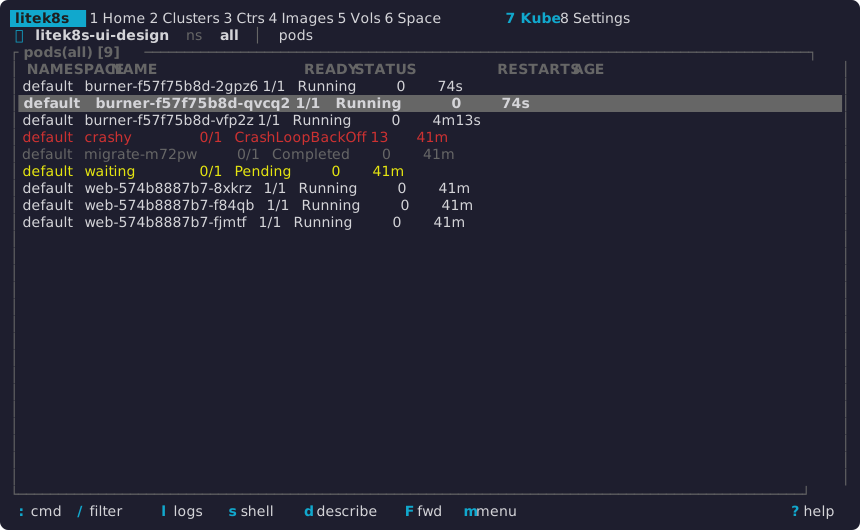
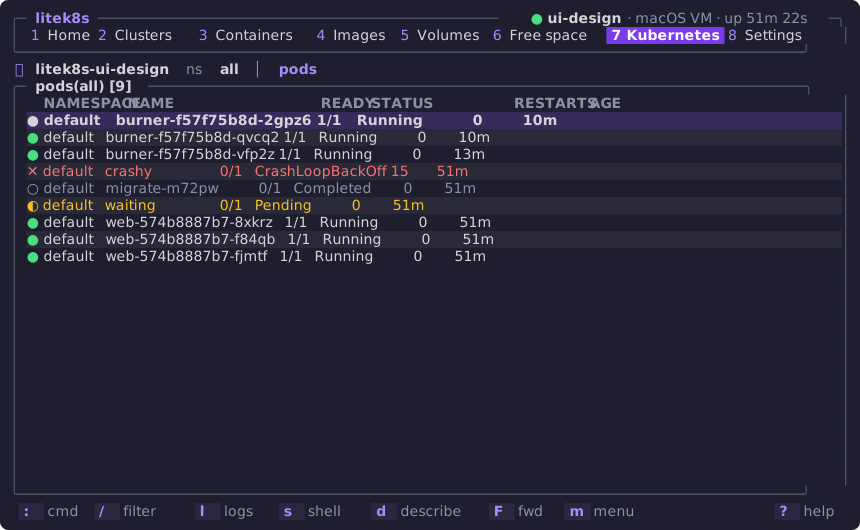
As text, 80x24 before:
 litek8s  1 Home 2 Clusters 3 Ctrs 4 Images 5 Vols 6 Space 7 Kube 8 Settings┌ Cluster ui-design ───────────────────┐┌ Resources ───────────────────────────┐│● up  macOS VM, up 48m 12s            ││CPU    ██  24% of 1 CPU = 6% of 4     ││API      http://127.0.0.1:51814       ││Memory █████   644 MB / 4.1 GB        ││Docker   …tek8s/ui-design/docker.sock ││Disk      252 MB used, 44.4 GB free   ││Engine   API 27.5.1 (aarch64)         ││Ctrs   3/5 running   Pods 6/9         ││VM IP    192.168.64.37                ││Images 3  (93.3 MB)                   │└──────────────────────────────────────┘└──────────────────────────────────────┘┌ Memory · 644 MB (what macOS charges the VM)  b: next ────────────────────────┐│litek8s (ui-design)     11.3 MB   API server, controllers, node agent         ││pods & containers       26.5 MB                                               ││Linux kernel + base      331 MB   fixed cost: kernel, root fs in RAM          ││cache                    130 MB   reclaimable                                 ││freed in the VM          146 MB   macOS takes it back when it needs it        │└──────────────────────────────────────────────────────────────────────────────┘┌ Your tools point at ─────────────────────────────────────────────────────────┐│✗ docker context   default                                                    ││  DOCKER_HOST      unset                                                      ││✓ kubectl context  litek8s-ui-design  (~/.kube/config)                        │└──────────────────────────────────────────────────────────────────────────────┘ Switch docker/kubectl to litek8s in Settings (8). Help: ?
 u up  d down  R delete  b breakdown  2 clusters                         ? help
and after: one column, the header a single line, the cluster’s meters and
pods by state, this cluster’s Docker API in a box of its own (its
containers, images, volumes and what they take), the breakdown b picks,
and where the tools point when there is room:
 litek8s DEV 1c5f21c16f3c · …  1 Home 2 3 4 5 6 7 8 9          ● dev · macOS VM╭─ ● dev · macOS VM · up 6m 18s ───────────────────────────────────── cluster ─╮│ cpu    ▎░░░░░░░░░░░░░░░░░░░░░░░░░░░░░   1% of 7 CPUs · 5% of one             ││ memory ███████████▒▒▒▒▒▒▒▒▒▒░░░░░░░░░  36% 1.5 GiB in use · VM limit 4.0 GiB ││ disk   ████████▍░░░░░░░░░░░░░░░░░░░░░  28% 6.0/80.0 GiB · Mac 16.7 GB free   ││ pods   ● 21 running                                                          │╰──────────────────────────────────────────────────────────────────────────────╯╭─ docker · ~/.litek8s/docker.sock ─────────── cpu 100.0% of one · mem 200 MB ─╮│ ● 2/2 running   images 25 · 4.6 GB   vols 1 · 983 MB                         │╰──────────────────────────────────────────────────────────────────────────────╯╭─ Memory · 3.2 GB (what macOS charges; VM ceiling 2.6/4.0 GiB)  b: next ──────╮│ litek8s (dev)        ▋             234 MB  API server, controllers, node ag… ││ pods                 ██▌           990 MB                                    ││ Docker containers    ▌             200 MB  Docker API containers, builds (n… ││ Linux kernel + base  ▉             342 MB  fixed cost: kernel, page tables   ││ cache                ██▎           880 MB  reclaimable                       ││ freed, still charged █▍            555 MB  macOS keeps it until the VM rest… │╰────────────────────────────────────────────────────── bar: VM limit 4.0 GiB ─╯ Switch docker/kubectl to litek8s in Settings (8). Help: ?
 u up  d down  R delete  b breakdown  c copy API  2 clusters            ?  help
A wide and tall terminal (here 120x40) gets the boxed header, CPU and memory side by side with their history (one column per sample, 2 s apart, for as long as Home has been on screen), disk, and the pods and the docker box under them:
╭─ litek8s DEV 1c5f21c16f3c ──────────────────────────────────────────────────────────── ● dev · macOS VM · up 6m 12s ─╮│ 1 Home 2 Clusters 3 Containers 4 Images 5 Volumes 6 Free space 7 Kubernetes 8 Settings 9 Observe │╰──────────────────────────────────────────────────────────────────────────────────────────────────────────────────────╯╭─ cpu · the VM process ────────────────────── bar: 1 CPU ─╮╭─ memory · what macOS charges… ─── bar: VM limit 4.0 GiB ─╮│ ││ ││ ▂ ││ ▁▁▁▁▁▁▁▁▁▁▁▁▁▁▁▁▁▁▁ ││ ▅▂▁▁▁▂▂▁▂▁▁▂▁▂▃█▂▁▁ ││ ███████████████████ ││ ▏░░░░░░░░░░░░░░░░░░░░░░░░░░░░ 1% of 7 CPUs · 4% of one ││ ██████▒▒▒▒▒▒░░░░░ 36% 1.5 GiB in use · VM limit 4.0 GiB ││ litek8s (dev) ▏ 0.2% API server, contro… ││ litek8s (dev) ▍ 234 MB API server, contro… ││ pods ▏ 1.8% ││ pods █▍ 993 MB ││ pod openbao/open… ▏ 0.4% ││ Docker containers ▎ 200 MB Docker API contain… ││ pod argocd/argoc… ▏ 0.4% ││ Linux kernel + base ▌ 340 MB fixed cost: kernel… ││ pod argocd/argoc… ▏ 0.3% ││ cache █▎ 880 MB reclaimable ││ Docker containers ██████ 100.0% Docker API contain… ││ freed, still charg… ▊ 554 MB macOS keeps it unt… ││ container burner ██████ 100.0% ││ ││ guest kernel & oth… ▏ 1.7% interrupts, networ… ││ ││ VM overhead ▏ 0.5% virtual devices, v… ││ │╰──────────────────────────────────────────────────────────╯╰──────────────────────────────────────────────────────────╯╭─ disk · litek8s and its VM disk ─────────── bar: 7.1 GB ─╮╭─ pods ───────────────────────────────────────────────────╮│ █████▎░░░░░░░░░░░░░ 28% 6.0/80.0 GiB · Mac 16.7 GB free ││ pods ● 21 running ││ litek8s itself ▏ 180 MB binary, VM kernel … │╰──────────────────────────────────────────────────────────╯│ cluster dev █████▍ 6.4 GB │╭─ docker · …cker.sock ─── cpu 100.0% of one · mem 200 MB ─╮│ images ████ 4.7 GB 1.3 GB reclaimable… ││ containers ● 2/2 running ││ container layers ▏ 1.4 MB what containers wr… ││ images 25 · 4.6 GB vols 1 · 983 MB ││ volumes █▌ 1.7 GB 982.5 MB reclaimab… ││ ││ logs ▏ 4.5 MB pods and container… ││ ││ builds ▏ 4.1 kB running builds, ca… ││ ││ objects ▏ 15.8 MB Kubernetes objects… ││ ││ other ▏ 1.6 MB metadata, IP alloc… ││ ││ rest of the VM disk ▏ 2.2 MB other clusters, fi… ││ ││ deleted in the VM ▍ 480 MB disk.img gives it … ││ │╰──────────────────────────────────────────────────────────╯╰──────────────────────────────────────────────────────────╯╭─ connections · your tools point at ──────────────────────────────────────────────────────────────────────────────────╮│ API http://127.0.0.1:58913 ✗ docker context orbstack ││ Docker ~/.litek8s/docker.sock DOCKER_HOST unset ││ Engine API 27.5.1 (aarch64) ✓ kubectl context litek8s-dev ││ VM IP 192.168.64.57 kubeconfig ~/.kube/config │╰──────────────────────────────────────────────────────────────────────────────────────────────────────────────────────╯ Switch docker/kubectl to litek8s in Settings (8). Help: ? u up d down R delete b breakdown c copy API 2 clusters ? helpTerminals. Nothing needs a Nerd Font: only box-drawing and block characters and a few common symbols. The UI adapts at start:
| how it is decided | what changes | |
|---|---|---|
| colors | NO_COLOR (non-empty): none; COLORTERM=truecolor/24bit: 24-bit; a TERM with 256 (and tmux, kitty, alacritty, ghostty, wezterm): 256; else 16 |
256: each color the nearest of the xterm palette; 16: the terminal’s own named colors (made for its background), the selection in reverse video; none: bold, dim, underline and reverse only |
| background | background: in ui.yaml; else asked of the terminal once with OSC 11 (see below); else COLORFGBG |
dark: lighter tones; light: darker ones and pale selections; unknown: mid tones that read on both, and a strong selection with its own text color; zebra rows only when the exact color is known |
| characters | ascii: true in ui.yaml, LITEK8S_UI_ASCII=1, or TERM=linux/vt100/vt220 |
box corners +, lines - ` |
| theme | theme: in ui.yaml |
default; high-contrast: the terminal’s bright colors, bold failures, no gray text or borders; mono: no colors at all |
theme: default # high-contrast, monobackground: auto # dark, light: skips asking the terminalascii: false # true: ASCII for fonts without box and block charactersSettings (8) shows what was found (Look: default, 24-bit color, dark background).
Asking for the background costs nothing that can fail: before the input
reader starts, the UI writes an OSC 11 query followed by a DA1 query and
reads the answers straight from the terminal. Terminals answer in order and
practically all answer DA1, so the wait ends at that answer: 0.1 ms in
tmux on the Mac, 11 ms over SSH to omarchy (one round trip); a terminal
that answers neither costs at most 150 ms once, and the UI starts with the
colors for either background. (The cursor-position query that once failed
the start in terminals that never answer is still not used.) It is skipped
when ui.yaml sets background, the theme is mono, or there are 16 colors
or fewer.
Cost. The history is a ring of 240 samples (two f32 each), filled by
Home’s 2 s samples only while Home is on screen, so it adds no timer and
no wake-up; hidden, nothing samples faster than before. Idle 60 s per view,
main against this look:
| Home | Containers | Kubernetes | |
|---|---|---|---|
macOS, 120x40, CPU (ps) |
0.07 % → 0.08 % | 0.00 % → 0.02 % | 0.00 % → 0.00 % |
Linux (omarchy), 80x24, CPU (/proc) |
0.12 % → 0.12 % | 0.02 % → 0.00 % | 0.00 % → 0.00 % |
| Linux, wake-ups (context switches) per minute | 124 → 130 | 19 → 8 | 13 → 13 |
| Linux, 120x40, Home | 0.12 % → 0.12 %, 137 → 119 wake-ups |
The first frame comes 1.0 ms → 1.2 ms after start (Mac, tmux). The binary grows by 70 KiB stripped on macOS arm64 (35 460 136 → 35 532 200 bytes; 42 798 032 → 42 889 088 as built) and 12 KiB on Linux x86_64 (41 294 312 → 41 306 696), with no new dependency.
Screens
Section titled “Screens”Captured from real sessions on the macOS VM and, over SSH, the Linux
rootless sandbox; the test runs used scratch paths and a second API port,
shown here as a default install has them (~/.litek8s, ~/.kube/config,
6443).
Home:
 litek8s DEV 1c5f21c16f3c · …  1 Home 2 3 4 5 6 7 8 9          ● dev · macOS VM╭─ ● dev · macOS VM · up 6m 18s ───────────────────────────────────── cluster ─╮│ cpu    ▎░░░░░░░░░░░░░░░░░░░░░░░░░░░░░   1% of 7 CPUs · 5% of one             ││ memory ███████████▒▒▒▒▒▒▒▒▒▒░░░░░░░░░  36% 1.5 GiB in use · VM limit 4.0 GiB ││ disk   ████████▍░░░░░░░░░░░░░░░░░░░░░  28% 6.0/80.0 GiB · Mac 16.7 GB free   ││ pods   ● 21 running                                                          │╰──────────────────────────────────────────────────────────────────────────────╯╭─ docker · ~/.litek8s/docker.sock ─────────── cpu 100.0% of one · mem 200 MB ─╮│ ● 2/2 running   images 25 · 4.6 GB   vols 1 · 983 MB                         │╰──────────────────────────────────────────────────────────────────────────────╯╭─ Memory · 3.2 GB (what macOS charges; VM ceiling 2.6/4.0 GiB)  b: next ──────╮│ litek8s (dev)        ▋             234 MB  API server, controllers, node ag… ││ pods                 ██▌           990 MB                                    ││ Docker containers    ▌             200 MB  Docker API containers, builds (n… ││ Linux kernel + base  ▉             342 MB  fixed cost: kernel, page tables   ││ cache                ██▎           880 MB  reclaimable                       ││ freed, still charged █▍            555 MB  macOS keeps it until the VM rest… │╰────────────────────────────────────────────────────── bar: VM limit 4.0 GiB ─╯ Switch docker/kubectl to litek8s in Settings (8). Help: ?
 u up  d down  R delete  b breakdown  c copy API  2 clusters            ?  help
The memory meter is what the cluster’s owners hold (litek8s, pods,
other clusters, the kernel and base; not the Docker API’s containers,
which the docker box shows) against the VM’s --memory, the
sandbox’s limit or, without one, the host’s RAM, as stacked parts; cache
(▒, dim) and pages the guest freed but macOS still charges (▒, darker)
follow, and do not count as in use. Its percentage is colored by how short
the guest really is (its MemAvailable, plus what the VM’s balloon would give
back), not by how full the meter looks: macOS’s footprint of the VM also
keeps pages the guest freed long ago and can exceed the VM’s size while the
guest has gigabytes available. It turns red, and says short, only when
less than a tenth or so is left.
Under the meters, Home explains its figures: what memory, CPU and disk are
made of, as inline bars. Every bar is its row’s value against a scale the
box names (bar: 1 CPU, bar: VM limit 4.0 GiB, bar: 305 MB, at the top
right of the box or, when the title needs the room, the bottom right), never
against the largest row, so bar and number agree: a row at 0.1 % of a CPU
is a sliver, one at 50 % half a bar, one past a whole CPU a full bar (its
number says how far past); a value that rounds to nothing prints <0.1%
with at most a hairline, and zero has no bar. One box at a time on 80x24 (b shows the next; a
tall terminal shows all three). Memory, on the Mac (a fresh VM running the
compat corpus):
╭─ Memory · 589 MB (what macOS charges; VM ceiling 1.0/4.0 GiB) b: next ──────╮│ litek8s (dev) ▏ 11.9 MB API server, controllers, node ag… ││ pods & containers ▏ 635 kB ││ Linux kernel + base ▌ 214 MB fixed cost: kernel, page tables ││ cache ▊ 296 MB reclaimable ││ freed, still charged ▏ 65.8 MB macOS keeps it until the VM rest… │╰────────────────────────────────────────────────────── bar: VM limit 4.0 GiB ─╯| line | what it is | from |
|---|---|---|
| litek8s (cluster) | the shown cluster’s own processes (API server, controllers, node agent, crun shims) on all its nodes | its cells’ cgroups: usage less file pages, less the pods’ |
| pods | its pods | the pod* cgroups under each node |
| Docker containers | the cluster’s Docker API’s containers and image builds: they run on its node, but are not the cluster’s (the cluster meter leaves them out, the docker box shows them) | the docker/*, build/* cgroups under each node |
| other clusters | the same three for every other running cluster, together | their cells |
| Linux kernel + base (macOS) | what the VM costs before anything runs: memory the kernel sets aside at boot (its image and the page structures, ~3.5 % of the VM’s size), its unreclaimable slab, stacks and page tables, and tmpfs (an older guest’s initramfs, the root filesystem held in RAM); also the VM’s own init, cell manager and DHCP client | the VM’s size less MemTotal and the balloon, /proc/meminfo |
| sandbox (Linux) | the supervisor, pasta and the cell manager | the sandbox’s cgroup less the clusters’ |
| cache | file pages: images, logs, the binary; the kernel drops them under pressure | /proc/meminfo (VM) or the sandbox’s file pages |
| freed, still charged (macOS) | pages the guest used once and has freed (or handed to the balloon since): Virtualization.framework keeps charging them to the VM until it stops, however much macOS needs memory (it compresses or swaps them like any other); the guest reuses them before it touches more. Restarting the VM (dev down, dev up) hands them back |
the footprint less what the guest uses |
The title also says how much of its memory the guest may use now when that is less than all of it: the VM’s ceiling, which grows on demand and shrinks when the guest is idle (dev.md); what is above it was never touched, and macOS charges nothing for it.
The headline figure is what macOS charges the VM process (its physical
footprint, what Activity Monitor shows) or, on Linux, the sandbox’s cgroup.
The guest’s numbers come from its cgroups and /proc/meminfo through the
VM’s control channel; a remote litek8s (--context) answers
GET /litek8s/v1/memory on its API server with its node’s split (litek8s,
pods and containers, cache) and its meminfo, which Home shows instead. It
is sampled with the rest of Home: every 2 s while Home is on screen, not
otherwise.
CPU, between the last two samples (2 s), in % of one CPU, on the Mac with three busy pods:
╭─ CPU · 26.0% of one CPU = 6% of 4 CPUs (the VM process) b: next ────────────╮│ litek8s (ui-design) ▏ 0.1% API server, controllers, node… ││ pods & containers ██▌ 25.4% ││ pod default/burner-f5… ▉ 8.4% ││ pod default/burner-f5… ▉ 8.3% ││ pod default/burner-f5… ▉ 8.3% ││ guest kernel & other ▏ 0.5% interrupts, network, the VM's… ││ VM overhead ▏ <0.1% virtual devices, vCPU exits (… │╰───────────────────────────────────────────────────────────────── bar: 1 CPU ─╯| line | what it is | from |
|---|---|---|
| litek8s (cluster) | the shown cluster’s own processes on all its nodes | its cells’ cpu.stat less its pods’ |
| pods, and the top 3 | every pod of the cluster, the busiest by name | the pod* cgroups (usage_usec) |
| Docker containers, and the top 3 | the cluster’s Docker API’s containers and builds | the docker/*, build/* cgroups |
| other clusters | the rest of the clusters together | their cells |
| guest kernel & other (macOS) | busy time the guest does not account to a cluster: interrupts, the network stack, the VM’s init | the guest’s /proc/stat less the clusters |
| VM overhead (macOS) | what the VM process ran beyond the guest’s busy time: virtual devices, vCPU exits | the VM process’s CPU time (macOS) less the guest’s /proc/stat |
| sandbox (Linux) | the supervisor, pasta and the cell manager | the sandbox’s cgroup less the clusters’ |
The title’s figure is the VM process’s CPU time as macOS counts it, or the
sandbox’s cgroup. The cluster’s cpu meter is that less the Docker
containers’ share, and its memory meter what is in use less theirs: the
Docker API’s containers run in the same VM or sandbox, but they are not
the cluster’s, so Home puts them in the docker box under the cluster
(docker · ~/.litek8s/docker.sock ── cpu 6.0% of one · mem 1.1 GB, then
the containers by state, images and volumes). Both meters are against
the VM’s --cpus and --memory (or the sandbox’s limits, else the
machine’s CPUs), never against the Docker engine’s /info: with
--docker-host the Docker views show another engine, and the docker box
then gives that engine’s own size (its engine: 16 CPUs · 34.4 GB)
instead of the cluster’s.
Disk, on the Mac with the workloads above (the walk is at most a minute old):
╭─ Disk · 305 MB (litek8s and its VM disk) b: next ───────────── bar: 305 MB ─╮│ litek8s itself ██████▍ 178 MB binary, VM kernel and root fs ││ cluster ui-design ███▊ 104 MB ││ images ███▋ 99.9 MB layers shared by pods, Docker, bu… ││ container layers ▏ 823 kB what containers wrote ││ volumes ▏ 340 kB Docker volumes, emptyDirs, PVs ││ logs ▏ 69.6 kB pods and containers, 10 MiB each ││ objects ▏ 1.9 MB Kubernetes objects, keys ││ other ▏ 1.1 MB metadata, IP allocations ││ rest of the VM disk ▏ 2.2 MB other clusters, filesystem ││ deleted in the VM ▊ 20.9 MB disk.img gives it back within a m… │╰──────────────────────────────────────────────────────────────────────────────╯| line | what it is |
|---|---|
| litek8s itself | the litek8s binary; on macOS also the VM’s kernel, root image and initrd and the signed copy of the binary the VM runs from |
| images | the unpacked layers of every image and of the build cache: one content-addressed store per node, shared by pods, Docker and builds, each layer once |
| container layers | what pod containers and Docker containers wrote (their overlay upper directories) |
| volumes | Docker volumes (named and anonymous), pods’ emptyDirs, local PVs, ConfigMap and Secret files |
| logs | pod and container logs (10 MiB and one rotated file each) |
| builds | builds in progress and RUN --mount=type=cache directories |
| objects | Kubernetes objects (the write-ahead log, compacted) and the cluster’s keys |
| other nodes | a multi-node cluster’s workers (each with its own image store) |
| other | metadata, IP allocations, staging |
| rest of the VM disk (macOS) | the other clusters and the filesystem’s own blocks |
| deleted in the VM (macOS) | blocks the guest freed that disk.img still holds: the guest trims its disk once it has been quiet for 30 s (at most once a minute), and Virtualization.framework punches the trimmed blocks out of the sparse image, so this goes back to about zero shortly after a prune |
Where images, container layers and volumes have something to reclaim, the
note says how much and points at the Free space view (6), which frees it:
those amounts come from the Docker API’s /system/df (unused images and
build cache, stopped containers, unused volumes). The categories come from
GET /litek8s/v1/disk on the cluster’s API server: one walk of the node’s
data directory that counts allocated blocks and hard links once, classifies
each file by where it is (so the parts add up to the whole), and runs at
most once a minute, in the background (Home asks every 30 s while it is on
screen). /system/df’s LayersSize now counts each layer once and images
report their SharedSize, as Docker does.
Against a remote litek8s (--context), the three boxes show its API server’s
node: GET /litek8s/v1/memory, /litek8s/v1/cpu (cumulative counters, two
samples make the percentages) and /litek8s/v1/disk, and its machine’s
/proc/stat for the rest of its CPU. Memory is the whole node’s, as free
sees it: litek8s, pods & containers, the operating system (kernel, its slab
and page tables, services such as sshd or tailscaled) and the page cache, out
of the node’s RAM; the graphs fill as on a local cluster. u, d and R
act on this machine’s dev clusters, so Home refuses them for a remote one,
and the Docker views (3 to 6), which read this machine’s dev cluster’s Docker
API unless --docker-host names another, say so instead of failing.
Against a cluster that is not litek8s (k3s, kubeadm, a managed one: its
/version has no +litek8s), there are no such endpoints, so Home reads
the public API instead. The header names what it is (k3s v1.35.0+k3s1,
RKE2, EKS, GKE, else Kubernetes). CPU and memory are what kubectl top nodes shows: each node’s use from metrics.k8s.io (metrics-server’s
NodeMetrics, asked every 2 s while Home is on screen) against what its Node
object has allocatable (listed every 30 s); the meters add up the cluster or
show the node n picked, and each scope’s history graph fills from then on.
The breakdowns are per node: memory, CPU and disk as shares of each node’s
allocatable (its root filesystem for disk), past 80 % in yellow and past 90 %
in red, with the prefix all node names share left out (…x7k2p). Disk comes
from each kubelet’s /stats/summary through the API server’s node proxy
(nodes/proxy get, every 30 s); refused by RBAC, Home says “not available”
and stops asking. Without metrics-server the meters show the allocatable
figures and say metrics.k8s.io not served instead of waiting. The
connections box says where the figures come from (no Docker, engine or VM:
those are this machine’s). Home only reads there; the Kubernetes view stays
read-only unless W or writableContexts.
Under the CPU and memory meters, a line says what the pods reserve
(their requests) and may use (their limits) of the nodes shown, against
those nodes’ allocatable resources, the way the scheduler and kubectl describe node count them (a pod’s requests are the larger of its
containers’ sum and its largest init container; Succeeded and Failed pods
reserve nothing), and how many pods have no limit:
reserved 10.6 GiB 35% · limits 28.1 GiB 93% · 14 pods without a limitThe meter is what is used now; this line is what the scheduler has
promised. Limits above 100% (red) mean the pods could together ask for
more than the nodes have. With several nodes, n steps from the whole
cluster to each node, and the line follows. In the Kubernetes view, the
nodes table (:nodes) gets the same per node: CPU REQ, CPU LIM, MEM REQ, MEM LIM, each with its share of the node’s allocatable, next to
CPU and MEM (use, from metrics.k8s.io).
After u on a stopped cluster, the output of litek8s dev up shows under
it (here on Linux, over SSH):
╭─ output ─────────────────────────────────────────────────────────────────────╮│$ litek8s dev up ││litek8s-dev ready in 0.10s (rootless, http://127.0.0.1:6443, kubectl context │╰──────────────────────────────────────────────────────────────────────────────╯On Linux the mode is rootless sandbox, and the meters are against the
machine (here omarchy’s 16 CPUs and 31.3 GiB, over SSH, idle) or, with a CPU
or memory limit set in Settings, against the limit; figures too small to
round to anything read <1% and <0.1%:
litek8s 1 Home 2 Clust 3 Ctrs 4 Imgs 5 Vols 6 Space 7 Kube 8 Set 9 Obs ● dev╭─ ● dev · rootless sandbox · up 16h 18m ────────────────────────── resources ─╮│ cpu ░░░░░░░░░░░░░░░░░░░░░░░░░░░░░ <1% of 16 CPUs · <1% of one ││ memory ▎░░░░░░░░░░░░░░░░░░░░░░░░░░░░ <1% 44.6 MB in use · host RAM 31.3 GiB ││ disk ░░░░░░░░░░░░░░░░░░░░░░░░░░░░░ <1% 191 MB used · 1.5 TB free ││ pods ● 0 running ││ ctrs ● 0/1 running ✕ 1 failed images 3 · 122 MB │╰──────────────────────────────────────────────────────────────────────────────╯╭─ CPU · 0.1% of one CPU = <1% of 16 CPUs (the sandbox) b: next ──────────────╮│ litek8s (dev) ▏ <0.1% API server, controllers, node agent ││ pods & containers 0.0% ││ sandbox ▏ <0.1% supervisor, pasta, cell manager │╰───────────────────────────────────────────────────────────────── bar: 1 CPU ─╯Containers, with a compose project (a worker that exited with 3) and a confirmation:
litek8s 1 Home 2 Clust 3 Ctrs 4 Imgs 5 Vols 6 Space 7 Kube 8 Set 9 Obs╭─ Containers ─────────────────────────────────────────────────── 3/5 running ─╮│ NAME STATE IMAGE PORTS ││ api ● running nginx:1.27-alpine 18080->80/tcp ││ scratch ○ exited busybox:1.36 ││▌▾ shop ◐ 2/3 up compose project ││ cache ● running redis:7-alpine 6379/tcp ││ web ● running nginx:1.27-alpine 80/tcp ││ worker ╭─ ⚠ Stop project shop? ────────────────────╮ ││ │ shop-cache-1 (redis:7-alpine, running) │ ││ │ shop-web-1 (nginx:1.27-alpine, running) │ ││ │ shop-worker-1 (busybox:1.36, exited) │ ││ │ │ ││ │ y yes n/esc no │ ││ ╰───────────────────────────────────────────╯ │╰──────────────────────────────────────────────────────────────────────────────╯ l logs s shell u start x stop r restart d remove / filter ? helpContainers and budgets
Section titled “Containers and budgets”On litek8s a compose project can have a resource budget
(docker.md). Its row
then shows the project’s memory against the budget (the meter Home uses),
the CPUs it uses out of its budget, and how many processes the OOM killer
took; a container the OOM killer stopped says OOMKilled instead of
exited, and the kill shows in the status line as it happens
(shop-worker-1 was OOM-killed: compose project shop hit its 256Mi budget):
╭─ Containers ─────────────────────────────────────────────────── 2/4 running ─╮│ NAME STATE IMAGE PORTS ││▌scratch ○ exited nginx:1.27 ││ ▾ shop ◐ 2/3 up ████▌░ 75% 192Mi/256Mi cpu 0.5/2 ✗ 1 OOM││ web ● running nginx:1.27 8080->80/tcp ││ db ● running nginx:1.27 8080->80/tcp ││ worker ✕ OOMKilled nginx:1.27 │╰──────────────────────────────────────────────────────────────────────────────╯A project without a budget shows its memory (mem 115Mi · no budget).
Use is sampled every 2 s while the view is on screen (one request to
/litek8s/v1/docker/projects) and not at all otherwise; other Docker
engines have no budgets and are not asked again.
l follows a container’s (or pod’s) log; ↑/PgUp scroll back and stop
following, G or f follow again, w wraps long lines. Escape sequences
are stripped, so colored logs cannot paint over the UI:
╭─ logs: api ─────────────────────────────────────────────────────── ● follow ─╮│ 2026/10/20 05:02:04 [notice] 1#1: OS: Linux 6.12.113-0-virt ││ 2026/10/20 05:02:04 [notice] 1#1: getrlimit(RLIMIT_NOFILE): 4096:4096 ││ 2026/10/20 05:02:04 [notice] 1#1: start worker processes ││ 2026/10/20 05:02:04 [notice] 1#1: start worker process 25 ││ 2026/10/20 05:02:04 [notice] 1#1: start worker process 26 ││ 2026/10/20 05:02:04 [notice] 1#1: start worker process 27 ││ 2026/10/20 05:02:04 [notice] 1#1: start worker process 28 │╰──────────────────────────────────────────────────────────────────────────────╯ esc back f follow w wrap ↑↓ scroll g/G top/end ? helps suspends the UI and opens a shell in the container (bash if it has one,
else sh) with your terminal’s size, following resizes; exit the shell to
come back. It is docker exec -it over the Docker API, so it needs no
docker CLI.
Images:
litek8s 1 Home 2 Clust 3 Ctrs 4 Imgs 5 Vols 6 Space 7 Kube 8 Set 9 Obs╭─ Images ─────────────────────────────────────────────────────── 3 · 93.3 MB ─╮│ IMAGE SIZE AGE USED BY ││▌busybox:1.36 4.1 MB 1250d scratch +7 ││ nginx:1.27-alpine 49.7 MB 551d api +4 ││ redis:7-alpine 39.5 MB 32d shop-cache-1 │╰──────────────────────────────────────────────────────────────────────────────╯ d remove / filter 6 free space ? helpFree space, and what p asks before it frees anything:
litek8s 1 Home 2 Clust 3 Ctrs 4 Imgs 5 Vols 6 Space 7 Kube 8 Set 9 Obs╭─ Reclaimable space ───────────────────────────────────────────── 0 B in all ─╮│ WHAT ITEMS SIZE ││▌[✓] Stopped containers 2 0 B ││ [✓] Dangling images (untagged, unused) 0 0 B ││ [✓] Build cache 0 0 B ││ [ ] Unused images (no container or pod) 0 0 B ││ [ ] Unused volumes (data is lost) 1 0 B │╰────────────────╭─ ⚠ Free space? ───────────────────────────╮─────────────────╯ Selected 0 B │ Stopped containers: 2 (0 B) │ │ About 0 B freed. This cannot be undone. │ litek8s data 31│ │s.litek8s/dev disk free 47.│ y yes n/esc no │ ╰───────────────────────────────────────────╯ Docker and Kubernetes share one image store: images no container or pod uses are unused (pods pull them again when needed). Volumes are never selected by default: they hold data. space select p free selected ? helpKubernetes, all namespaces (0); ctrl-z would keep the crashing and
pending ones:
litek8s 1 Home 2 Clust 3 Ctrs 4 Imgs 5 Vols 6 Space 7 Kube 8 Set 9 Obs ⎈ litek8s-ui-design ns all │ pods╭─ pods(all) [9] ──────────────────────────────────────────────────────────────╮│ NAMESPACE NAME READY STATUS RESTARTS AGE ││ ● default burner-f57f75b8d-2gpz6 1/1 Running 0 8m40s ││ ● default burner-f57f75b8d-qvcq2 1/1 Running 0 8m40s ││ ● default burner-f57f75b8d-vfp2z 1/1 Running 0 11m ││ ✕ default crashy 0/1 CrashLoopBackOff 14 49m ││ ○ default migrate-m72pw 0/1 Completed 0 49m ││ ◐ default waiting 0/1 Pending 0 49m ││ ● default web-574b8887b7-8xkrz 1/1 Running 0 49m ││ ● default web-574b8887b7-f84qb 1/1 Running 0 49m ││ ● default web-574b8887b7-fjmtf 1/1 Running 0 49m │╰──────────────────────────────────────────────────────────────────────────────╯ : cmd / filter l logs s shell d describe F fwd m menu ? helpMore of it in Kubernetes.
Settings of a cluster started with --cpus 4 while the file names none (so
its default, 7, would need a restart), and what the UI found about the
terminal:
╭─ Settings ───────────────────────────────────────────────────────────────────╮│ SETTING VALUE ││▌VM CPUs 7 (default) ││ VM memory (MiB) 4096 (default) ││ Shared directories $HOME (default) ││ API port (dev) 6443 (default) ││ Published ports on localhost only ││ docker context default (enter: use litek8s) ││ kubectl context litek8s-ui-design ✓ (enter: switch back) ││ Config file ~/.litek8s/config.yaml (enter: $EDITOR) │╰──────────────────────────────────────────────────────────────────────────────╯ ⟳ Restart needed for CPUs: Home (1), d then u. CPUs, memory and shares size the macOS VM. Settings apply on the next `litek8s dev up` (its flags win). Look: default, 24-bit color, background unknown (ui.yaml) enter edit del default space toggle ? helpClusters
Section titled “Clusters”litek8s dev runs as many clusters as you like in one VM or sandbox
(dev.md); view 2 lists them, with the VM’s or
sandbox’s size and what it uses, and the other contexts of your kubeconfig
(a home cluster, a cloud one): enter on one shows it in the Kubernetes
view, read-only unless you allow it, and
showOtherContexts: false in ui.yaml leaves them out of the
list. On the Mac, with a 3-node cluster and a stopped one:
 litek8s 1 Home  2 Clust 3 Ctrs 4 Imgs 5 Vols 6 Space 7 Kube 8 Set 9 Obs  ● dev╭─ Local clusters ──────────────── shared VM: 4 CPUs, 4.3 GB max, 412 MB used ─╮│ NAME           STATE       API              NODES MEMORY    AGE  CONTEXT     ││▌› dev          ● up        127.0.0.1:6443   1     27.2 MB   8m   litek8s-dev ││   ci           ● up        127.0.0.1:61325  3     5.6 MB    2m   litek8s-ci  ││   old          ○ down      -                1     -         3d   litek8s-old │╰──────────────────────────────────────────────────────────────────────────────╯╭─ Other kubeconfig contexts ── read-only by default · enter: Kubernetes view ─╮│   home                          https://192.168.1.10:6443                    │╰──────────────────────────────────────────────────────────────────────────────╯ All clusters share one VM (its CPUs and memory: Settings).
  n  new   u  up   d  down   D  delete   t  tree   enter  use         ?  help
› marks the cluster the other views show; ● up, ◐ starting or
stopping, ○ down. MEMORY is the cluster’s own:
its nodes’ processes and pods, counted the way docker stats counts a
container (the binary and the VM’s kernel are shared and not in it); the
title’s figure is the whole VM (or sandbox). NODES shows 2/3 while a node
is not Ready.
n asks for a name and a node count, and says what the cluster shares:
╭─ New cluster ────────────────────────────────────────────────────╮ │ › Name ci2█ │ │ Nodes 1 │ │ │ │ Runs in the shared VM: 4 CPUs, 4096 MiB for all clusters. │ │ Context litek8s-ci2, socket ~/.litek8s/ci2/docker.sock │ │ Nodes after the first are workers joined like real nodes. │ │ │ │ tab next field enter create esc cancel │ ╰──────────────────────────────────────────────────────────────────╯and runs litek8s dev up --name ci2 --nodes 3 --no-switch (kubectl’s
current context stays as it is), its output under the list. D says what
goes before it goes (here on Linux):
╭─ Delete cluster t1? ───────────────────────────────────────────────────────╮ │Stops it and DELETES all of its data: │ │Kubernetes objects, pods, Docker containers, images, volumes │ │and the build cache, in ~/.local/share/litek8s/dev/clusters/t1/data. │ │The kubectl context litek8s-t1 is removed. This cannot be undone. │ │ │ │ y yes n/esc no │ ╰────────────────────────────────────────────────────────────────────────────╯enter on a local cluster shows it everywhere (Home, Containers, Images,
Volumes, Free space and Kubernetes follow its Docker socket and API) and
then asks whether kubectl and docker should point at it too
(current-context and the docker context litek8s-<name>); the UI
remembers it for next time. enter on another context shows that context
in the Kubernetes view only (nothing to start or stop there); enter on a
local cluster comes back.
While a cluster or its engine is down, Home says so instead of counting
nothing: pods –, ctrs – (engine not running), not 0/0 and 0 (0 B).
Observe
Section titled “Observe”View 9, on the cluster’s built-in metrics, logs and alerts (observability.md):
litek8s 1 Home 2 Clust 3 Ctrs 4 Imgs 5 Vols 6 Space 7 Kube 8 Set 9 Obs ● dev╭─ Alerts ────────────────────────────────────────────── 3 firing · 0 pending ─╮│ ✕ firing NodeFilesystemAlmostFull 7m Node obs-smoke has 4.853% disk lef…││ ◐ firing KubePodCrashLooping 6m default/crasher-778d767f48-4zrkx (…││ ◐ firing KubePodRestartLoop 5m default/crasher-778d767f48-4zrkx (…│╰──────────────────────────────────────────────────────────────────────────────╯╭─ Pods by CPU ─────────────────────────── % of limit, r: of request · 30 min ─╮│ NAMESPACE POD CPU/LIMIT % MEM/LIMIT % CPU ││▌shop api-0 475m/500m 95% 243Mi/256Mi 95% ███████████││ shop worker-1 300m/100m r300% 100Mi/200Mi r 50% ▅▅▅▅▅▅▅▅▅▅▅││ shop cache-2 20m/— — 50Mi/— — ▁▁▁▁▁▁▁▁▁▁▁││ │╰──────────────────────────────────────────────────────────────────────────────╯ l logs L search logs s sort a/A ack n namespace ? help- Alerts first:
✕firing and critical,◐firing,○pending or acknowledged (dim);aacknowledges the selected pod’s alerts,Aall of them (each silenced until it resolves; asks first). - Pods by CPU (cores,
m= millicores) or memory (working set;sswitches), top consumers first. Each figure is shown against the pod’s limit (used/limitand the share, colored green to red), summed over its containers and sidecars; a pod with a container without a limit has none. Without a limit the request stands in (rbefore the share; above 100 % is fine there, the pod is just using more than it reserved); with neither,/—. Then a sparkline over the last 30 minutes (one cell per ~2 minutes; a gap where there was no sample): the sorted resource’s on 80 columns, both on wide terminals.ncycles namespaces,/filters. - Logs:
lopens every log of the selected pod over the last hour, following, including containers that restarted or are gone;Lasks for a regex and searches every pod’s logs (of the namespace shown) over the last hour, then follows.
It reads /prometheus/api/v1/query_range (two queries) and
/litek8s/v1/alerts every 10 s while the view is on screen, and nothing
otherwise; against an API server with --no-observability it says so.
Settings: ~/.litek8s/config.yaml
Section titled “Settings: ~/.litek8s/config.yaml”The Settings view edits a small file that litek8s dev up reads (its flags
win over it); $LITEK8S_CONFIG moves it. Every change is validated before it
is written: CPUs between 1 and the machine’s, memory between 1024 MiB and
its RAM, a disk of 16 to 4096 GiB, a port of 1024 or above, shared directories that exist, are
absolute, do not overlap and are not already shared.
cpus: 4 # macOS: the VM's CPUs (default: half the Mac's, at most 8) # Linux: a CPU limit on everything the dev cluster runs (default: none)memory: 4096 # MiB; macOS: the VM's ceiling (default 4096); Linux: a limit (default: none)disk: 64 # GiB, macOS: the VM's data disk; bigger grows it at the VM's next start, never shrinksshares: # macOS: directories shared with the VM at the same path (default: $HOME; - /Users/me # /tmp and /var/folders are always shared) - /Volumes/srcport: 6443 # the API server's port on localhostpublish: localhost # where published container ports and NodePorts listen: # localhost (default) or all (other machines on the network too)docker: # Docker API: compose project budgets, container defaults projects: {shop: {memory: 2Gi, cpus: 2}} default_project: {memory: 4Gi}The file is read when the cluster starts. The cluster records what it
started with, so the Settings view (and nothing else) tells you which
changes still need d and u on Home. “Config file” opens it in
$VISUAL/$EDITOR (vi otherwise) and checks it when the editor exits;
a changed docker: section goes to the running cluster’s Docker API at
once (no restart, see docker.md).
Contexts: pointing your tools at litek8s
Section titled “Contexts: pointing your tools at litek8s”Home shows, and Settings switches:
- docker context. “use litek8s” creates (or updates) a
litek8scontext forunix://~/.litek8s/docker.sock(for another cluster,litek8s-<name>for~/.litek8s/<name>/docker.sock) and makes it current, withdocker contextwhen the CLI is installed and by writing the CLI’s context store ($DOCKER_CONFIG/contexts,config.json) when it is not. “switch back” returns to the context that was current before (defaultif none was recorded).DOCKER_HOST, when set in your shell, wins over any context; Home says so. - kubectl context. “use litek8s-dev” makes the shown cluster’s context
(
litek8s-<name>) current (adding it if the cluster runs); “switch back” restores the previous current context. Nothing else in the kubeconfig changes.
What was current before is kept in ~/.litek8s/ui-state.json.
Kubernetes: a cluster UI
Section titled “Kubernetes: a cluster UI”View 7 is a cluster UI in the spirit of k9s, for any cluster: the local dev clusters, and every context of your kubeconfig (k3s, kind, EKS, GKE, AKS, …). Its keys are k9s’s where k9s has one, so k9s habits work; it is lighter (see the numbers) and comes with litek8s.
litek8s ui --context prod -n payments # start on a context and namespaceor :ctx inside to pick one. Credentials are what kubectl reads:
$KUBECONFIG (all its files, merged as kubectl merges them), tokens, token
files, client certificates, basic auth, and exec plugins
(gke-gcloud-auth-plugin, aws eks get-token, kubelogin, …), run when a
token is needed and again when it expires or the server refuses it. Every
request goes to the context the UI shows; :kubectl passes it as
--context, so the kubeconfig’s current context is never used by accident.
Read-only clusters
Section titled “Read-only clusters”Only litek8s’s own clusters can be changed from the UI by default. Any
other context (a cloud cluster, a colleague’s) is read-only: you can
list, describe, read YAML and logs, follow the tree and port-forward, but
deletes, edits, applies, scaling, rollout restarts and undos, cordon and
drain, running a CronJob, shells, :kubectl commands that change things
(anything but get, describe, logs, top, rollout status, …) and
plugins not marked mutates: false are refused, with a message saying how
to allow it. The header shows read-only for such a context.
W turns writing on for the context shown: it asks you to type the
context’s name (as GitHub does for dangerous actions), and from then on the
header shows a red WRITE · <context>. tab in that dialog also saves
it to writableContexts in ui.yaml; without it, write mode lasts until
the UI exits. W again goes back to read-only at once (and takes the
context out of writableContexts if it was there). W is reserved: your
hotkeys cannot take it.
A context counts as litek8s when it is one of litek8s dev’s clusters
(litek8s-<name>, lkdev-<name> with $LITEK8S_HOME, checked against the
clusters on disk) or its API server says so (/version reports
v1.33.0+litek8s; asked once per context). To change another cluster from
here, list it in ui.yaml:
writableContexts: [staging, home]readOnly: true makes every cluster read-only, litek8s’s included; W
then says so.
On other Kubernetes clusters
Section titled “On other Kubernetes clusters”The Kubernetes view speaks only the standard API, so it works the same on
EKS, GKE, AKS, Civo, k3s, kind or any conformant cluster: discovery
(aggregated, else per group), server-side Tables, list+watch, describe,
YAML, edit with a server dry run, logs, exec (WebSocket v5/v4),
port-forward (SPDY), the tree and xray, :kubectl. Credentials come from
the kubeconfig as kubectl’s do (exec plugins, tokens, client certificates,
tls-server-name); nothing impersonates anyone. What is litek8s’s own, and
what you see elsewhere:
| on litek8s | on another cluster | |
|---|---|---|
| changes (delete, edit, scale, shells, …) | allowed | read-only until W or writableContexts |
| CPU and MEM columns | from metrics.k8s.io when served |
the same: shown when the cluster has metrics-server, absent otherwise |
| Observe (9): pod CPU/memory history, alerts, log search | the API server’s built-in metrics, alerts and log store | not there: the view says the cluster is not litek8s (logs: l on a pod or workload) |
Home (1) with --context: node memory, CPU, disk |
litek8s’s node endpoints | Nodes’ allocatable, metrics.k8s.io and the kubelets’ stats when allowed (Screens) |
| Docker views (3-6) | the cluster’s Docker socket | whatever --docker-host points at, independent of the context |
| the tree’s Services → pods | from the Service Table’s Selector column | the same (kubectl’s wide column; older servers: read as objects) |
Command mode (:)
Section titled “Command mode (:)”| command | what it shows or does |
|---|---|
:pods, :po, :deploy, :dp, :svc, :ing, :no, :ns, :ev, :crd, :cm, :sec, :pvc, … |
that resource type: any type the cluster serves, custom resources and aggregated APIs included, by plural, singular, short name, kind or plural.group (:certificates.cert-manager.io, :cert) |
:pods kube-system, :pods -n kube-system, :deploy -A |
in a namespace, or all of them |
:pods -l app=web,tier!=db, :pods -f status.phase=Running, :pods /nginx |
with a label selector, a field selector (sent to the server), a filter |
:ctx / :ctx prod |
pick a context / switch to one (the views reconnect) |
:ns / :ns web |
the namespaces / switch the namespace |
:tree, :tree shop, :tree -A --all |
the cluster as litek8s tree draws it, live (below); --all adds old ReplicaSets |
:xray deploy [ns] |
owner trees: deploy → ReplicaSets → pods → containers (also sts, ds, rs, job, cronjob → jobs → pods, svc → its pods, node → its pods) |
:kubectl get events -A, :!top pods, ! |
kubectl on the UI’s context and namespace; its output in a pager (exec -it, edit, attach get the terminal) |
:pf |
the running port-forwards |
:aliases |
every resource type, to pick one |
:help, :q |
the keys; quit |
tab (or →) completes resource names, commands, namespaces after -n or
:ns, contexts after :ctx; the first candidate shows greyed after the
cursor. ↑/↓ walk the history (kept in ~/.litek8s/ui-history).
Aliases of your own come from ui.yaml.
Columns are the server’s: the same Table kubectl prints (custom resources’
printer columns included), ctrl-w adds the wide ones (-o wide). Ages are
computed from the creation time, so they move on. Rows are colored by
health: pods by their status and readiness, workloads by ready counts,
nodes by conditions, anything with a Status column by its words.
Filters (/)
Section titled “Filters (/)”The list narrows as you type; tab switches the mode:
| filter | keeps |
|---|---|
web |
rows whose name or any cell contains it (substring, any case) |
^web-\d+ |
the same as a regex (mode regex) |
wbf |
fuzzy: the letters in order, tighter matches first (mode fuzzy) |
!running |
the rows that do not match |
-l app=web,tier in (a,b),!canary |
rows whose labels match the selector (matched here, instantly) |
-f status.phase=Running |
a field selector, sent to the server (a list of its own) |
They combine (!running -l app=web). Each resource type keeps its last
filter while the UI runs, and the table’s title shows it. ctrl-z keeps
only the rows that are not fine (crashing, pending, not ready); esc
clears marks, then the filter, then goes back.
Sorting: < and > pick the column (an arrow marks it), O reverses it,
N A S sort by name, age (newest first), status as in k9s. Numbers sort
as numbers, 2/3 by its counts, 512Mi and 250m by size.
Acting on objects
Section titled “Acting on objects”m opens the selected row’s actions as a menu; each has a key:
| key | on | does |
|---|---|---|
enter |
deploy, sts, ds, rs, job, svc, node | its pods (by its selector, or on the node) |
enter |
pod / ns / crd / cronjob | its containers / switch to it / its objects / its jobs |
d / y |
anything | describe (kubectl’s, events at the end) / YAML (m there shows managedFields) |
e |
anything | edit in $EDITOR (below) |
ctrl-d, del |
anything | delete, asking first; p there picks the cascade (Background, Foreground, Orphan), f no grace period |
ctrl-k |
pod | kill: delete with no grace period (asks) |
space |
anything | mark; actions apply to every marked row (ctrl-\ unmarks) |
l / p |
pod, container, workload, svc | logs / the previous containers’ logs |
s |
pod, container | a shell (pick the container when there are several) |
s |
deploy, sts, rs | scale |
r / u / H |
deploy (r: sts, ds too) |
rollout restart / undo (to the previous revision) / history and status |
F |
pod, svc, deploy, sts, rs | port-forward (a service’s or workload’s goes to one of its ready pods) |
f |
the port-forwards (d stops one) |
|
t |
anything | the tree of the namespace, the cursor on this object (t again: back) |
c / u / r |
node | cordon / uncordon / drain (evictions, honoring PodDisruptionBudgets; DaemonSet pods stay) |
T |
cronjob | run it now (a Job from its template) |
x |
secret / workloads | decode its data / its xray tree |
enter, x / s / p / r / R / T |
Argo CD Application | its resources / sync (asks) / sync and prune (asks) / refresh / hard refresh / terminate the running sync (asks); see Applications |
o / J / E |
pod / anything owned / anything | its node / its owner / its events |
c / C |
anything | copy the name / the YAML (OSC 52, so it works over SSH) |
n / 0 |
pick a namespace / all namespaces and back |
Edit works like kubectl edit, with the server checking it first: the
object goes to $EDITOR as YAML; what comes back is sent as a dry run
(PUT ?dryRun=All), so the API server validates it (schemas, admission
webhooks) without changing anything. A mistake comes back into the editor
as comment lines (# Error: ...) over your edit; a valid change shows as a
diff, which y applies (e edits again, esc drops it):
╭─ edit deploy/team-0/web (validated by the server; not applied yet) y apply · e edit · esc drop ─╮│@@ -13,7 +13,7 @@ ││ uid: 256ba4d2-d410-42be-99f6-f48045d36606 ││ spec: ││ progressDeadlineSeconds: 600 ││- replicas: 3 ││+ replicas: 4 ││ revisionHistoryLimit: 10 │l on a pod with several containers asks which (or all of them); on a
deployment, statefulset, daemonset, job or service it follows every
container of every pod it selects (up to logs.maxStreams, 30), each with
a colored prefix, interleaved by time (here nginx’s start-up lines):
╭─ logs deploy/default/web (all pods) ────────────────── ● follow · 3 streams ─╮│ fjmtf/nginx 2026/10/20 05:02:04 [notice] 1#1: nginx/1.27.5 ││ fjmtf/nginx 2026/10/20 05:02:04 [notice] 1#1: built by gcc 14.2.0 (Alpine 14.││ fjmtf/nginx 2026/10/20 05:02:04 [notice] 1#1: OS: Linux 6.12.113-0-virt ││ fjmtf/nginx 2026/10/20 05:02:04 [notice] 1#1: getrlimit(RLIMIT_NOFILE): 4096:││ fjmtf/nginx 2026/10/20 05:02:04 [notice] 1#1: start worker processes │╰──────────────────────────────────────────────────────────────────────────────╯ esc back f follow / filter t time w wrap p previous ^s save ? helpf pauses and follows again, / keeps the matching lines (highlighted;
tab for regex or fuzzy), t timestamps, w wrap, p the previous
containers’ logs, c copies, ctrl-s saves to a file (in
$TMPDIR/litek8s/), x clears. The buffer keeps the last logs.buffer
lines (10 000); each stream starts with its last logs.tail lines (100).
Shells and port-forwards
Section titled “Shells and port-forwards”s suspends the UI and opens a shell (bash if the image has it, else ash
or sh) in the container, over the API server’s exec WebSocket, resized
with the terminal; exiting it comes back to the same view with its exit
code. F asks for local:remote with the object’s ports listed (names
work: 8080:http); forwards listen on 127.0.0.1 until stopped or the UI
exits, show as ⇄n in the header, and f lists them with their
connection counts.
╭─ xray deployments(all) ──────────────────────────────────────────────────────╮│ ▾ ● deploy default/burner 3/3 ready ││ ▾ ● rs burner-f57f75b8d 3/3 ready, revision 1 ││ ▾ ● pod burner-f57f75b8d-2gpz6 Running 1/1 ││ ● container burn running, ready, busybox:1.36 ││ ▾ ● pod burner-f57f75b8d-qvcq2 Running 1/1 ││ ● container burn running, ready, busybox:1.36 ││ ▾ ● pod burner-f57f75b8d-vfp2z Running 1/1 ││ ● container burn running, ready, busybox:1.36 ││ ▾ ● deploy default/web 3/3 ready ││ ▾ ● rs web-574b8887b7 3/3 ready, revision 1 ││ ▾ ● pod web-574b8887b7-8xkrz Running 1/1 ││ ● container nginx running, ready, nginx:1.27-alpine │╰──────────────────────────────────────────────────────────────────────────────╯enter folds a branch; d, y, e, l, s, ctrl-d act on the row’s
object (on a container row: its logs and shell); ctrl-r reloads it.
Argo CD Applications
Section titled “Argo CD Applications”:apps (or :applications) lists Argo CD’s Applications with their Sync
Status and Health Status columns, colored by both (Degraded red; out of
sync, Progressing or Missing yellow). They are read and driven through the
Kubernetes API alone, so this works with Argo CD or any controller that
reconciles its argoproj.io manifests, on any cluster:
| key | does |
|---|---|
enter, x |
the apps of the namespace down their resources, from each app’s status: sync and health of every resource, the health message (exceeded its progress deadline), to prune, hooks; an app another app manages (app of apps) is drawn under its parent; it follows the apps live (loaded again when one changes, cursor and folds kept) |
D |
the diff with git: per resource out of sync, missing or to prune, - live and + git, only the fields git sets, Secret values masked. Read from the Secret <app>.diff next to the app (key diff.json, label gitops.litek8s.dev/diff), which the controller writes after each comparison: {revisions, resources: [{group, version, kind, namespace, name, status, desired, live, omitted}]}, the live object cut to the fields of desired (plus those the last apply set), null for the side that does not exist. Argo CD keeps its diffs in argocd-server instead (argocd app diff) |
s |
sync: writes the operation the argocd CLI writes (the app’s sync options, the hook strategy), after asking; refused while another operation runs |
p |
the same with prune: what git no longer has is deleted |
r / R |
refresh / hard refresh (the argocd.argoproj.io/refresh annotation) |
T |
terminate the running sync (as argocd app terminate-op), after asking |
╭─ xray applications(argocd) ──────────────────────────────────────────────────╮│ ▾ ✕ app web OutOfSync · Degraded @ 0123456 ││ ✕ deployment web/web OutOfSync · Degraded: exceeded its progress deadli…││ ● service web/web Synced · Healthy ││ ◐ configmap web/old OutOfSync, to prune │╰──────────────────────────────────────────────────────────────────────────────╯ esc back enter fold s sync r refresh d describe ^r reload ? helpArgo CD v3 keeps each resource’s health out of the Application’s status
(resourceHealthSource: appTree: it lives in Argo CD’s own cache); where
the status has none, the tree reads the live object and judges it the way
Argo CD does for the kinds that say why an app is not Healthy
(Deployments, StatefulSets, DaemonSets, ReplicaSets, Jobs, Pods, PVCs: a
failed Job’s message, a rollout past its progress deadline, a crash loop).
On an app row of that tree s, p, r, R, T act on it, on a
resource row d, y, e, l act on the object; ctrl-r reloads it.
Syncs, refreshes and terminations are changes: read-only clusters refuse
them like any other. The same reads and actions are tools of
litek8s mcp (applications_list, application_status,
application_sync, application_refresh).
t on any list (or :tree, or t on a cluster in the Clusters view)
shows what litek8s tree --context <ctx>
prints, and keeps it current: nodes, then each namespace’s workloads down
their controllers (CronJob → Job → Pod, Deployment → ReplicaSet → Pod,
StatefulSet, DaemonSet and Job → Pod, pods with no owner) and its services
with how many of the pods they select are ready. Both are drawn by one
builder (src/tree.rs); the UI feeds it the rows its informers already
keep for the nine kinds, so the tree costs no requests of its own and
changes as the watches do (a 5 000-pod tree is rebuilt in about 8 ms, at
most once a second while pods keep changing).
╭─ tree all namespaces ─────────────────────────────────────────── 11 objects ─╮│ ├─ ◐ namespace default ││ │ ├─ ◐ Pod solo Pending ││ │ └─ ● Service kubernetes ClusterIP 10.43.0.1 443 ││ ├─ ● namespace kube-system ││ │ └─ ● Service kube-dns ClusterIP 10.43.0.10 53,53 ││ └─ ◐ namespace shop ││ ├─ ● CronJob tick schedule */5 * * * * ││ ├─ ◐ Deployment api 0/3 ready ││ │ └─ ◐ ReplicaSet api-6bcdd669f6 0/3 ready ││ │ ├─ ◐ Pod api-6bcdd669f6-mm7gl Pending ││ │ ├─ ◐ Pod api-6bcdd669f6-mvswq Pending ││ │ └─ ◐ Pod api-6bcdd669f6-wn8fn Pending ││ ├─ ◐ Job once 0/1 done ││ │ └─ ◐ Pod once-927zc Pending ││ └─ ◐ Service api ClusterIP 10.43.0.11 80 → 0/3 pods │╰──────────────────────────────────────────────────────────────────────────────╯ t/esc back space fold enter describe / filter l logs 0 all ns ? helpEach line has its state’s glyph and color (running and ready green,
pending or partly ready yellow, crashing or failed red); a namespace takes
the worst of what is in it. space folds and unfolds a branch (▸ 3 more
says what it hides), → unfolds, ← folds or goes up to the parent;
enter describes the object (on a namespace line it folds), d y e
l s F c ctrl-d act on it as in the tables; / keeps the
matching lines with what they are under; 0 switches between the
namespace and all of them, H shows the old ReplicaSets, ctrl-r lists
everything again, t (or esc) goes back to the list. Opened with t
on a deployment, pod, job…, the cursor starts on that object. A cluster in
tree mode stays in it when you switch context. A list the cluster refuses
(nodes is forbidden) says so at the top and the rest still shows. On an
older litek8s whose Service Table has no Selector column, the tree reads
the services as objects, so they still show → ready/total pods as
litek8s tree does. Your ui.yaml hotkeys and plugins come before the
built-in keys: one bound to t takes it.
ui.yaml
Section titled “ui.yaml”~/.litek8s/ui.yaml (next to config.yaml; $LITEK8S_UI_CONFIG to put it
elsewhere), every part optional:
aliases: # :cp → pods -n kube-system -l tier=control-plane cp: pods -n kube-system -l tier=control-planehotkeys: # a key runs a command line shift-1: ":pods -A" f2: "!get events -A --sort-by=.lastTimestamp"plugins: # your commands, on the selected row - name: dive key: ctrl-i scopes: [pods] # resource names, or all command: dive args: [$COL-IMAGE] # $NAME $NAMESPACE $CONTEXT $RESOURCE $CONTAINER $COL-<COLUMN> - name: stern key: shift-l scopes: [deploy] command: stern args: [-n, $NAMESPACE, $NAME] background: true # output in a pager instead of the terminal confirm: false # true: ask first mutates: false # it only reads: also runs on read-only clusterstheme: default # high-contrast, mono; see Lookbackground: auto # dark, lightascii: false # true (or LITEK8S_UI_ASCII=1): ASCII onlyskin: # names, 0-255 or #rrggbb, over the theme's colors accent: cyan selected: darkgray warn: yellow bad: redlogs: {tail: 100, buffer: 10000, timestamps: false, wrap: false, maxStreams: 30}readOnly: false # true: no deletes, edits, scaling, shells, anywherewritableContexts: [] # other clusters that may be changed (W with "remember" adds here)showOtherContexts: true # false: Clusters lists litek8s's clusters onlykubectl: kubectl # which kubectl `:kubectl` runsHotkeys and plugins are checked before the built-in keys, so they can take
any of them. Variables are also passed to plugins as environment variables.
skin colors go over the theme’s (see Look); NO_COLOR and
theme: mono ignore them. --mouse
selects rows with a click and scrolls with the wheel.
Kubernetes keys
Section titled “Kubernetes keys”| where | keys |
|---|---|
| tables | : command, / filter, t tree, W write mode, ! kubectl, ? help, m actions, enter open, esc back, n namespace, 0 all namespaces, space mark, < > O N A S sort, ctrl-w wide, ctrl-z faults, ctrl-r reload, f port-forwards, and the actions |
| pagers (describe, YAML, kubectl, help) | / search, n/N next/previous match, w wrap, ←→ scroll sideways, e edit, y/d YAML/describe, m managedFields, c copy, ctrl-s save, esc back |
| logs | f follow/pause, / filter, t timestamps, w wrap, p previous, c copy, x clear, ctrl-s save, esc back |
| xray | enter fold, d y e l s ctrl-d on the row, ctrl-r reload; on an Application row s p r R T |
| tree | t/esc back, space fold, ← → fold/up and unfold, enter describe, d y e l s F c ctrl-d on the row, / filter, 0 all namespaces, H old ReplicaSets, ctrl-r reload |
1-8 and tab still switch views, q quits.
For other views and tools
Section titled “For other views and tools”The Kubernetes view’s pieces are separate so other parts of litek8s can use
them: kube::ops (one async function per API action), kube::informer
(compact, watched lists), kube::describe, and extra table columns:
a KMsg::Ext { kind, column, values } message adds a column (values by
namespace/name) to every table of that kind. The CPU and MEM columns
from metrics.k8s.io are one; an observability view can add its own
(request rates, error counts) the same way, without touching the table
code.
Kubernetes performance
Section titled “Kubernetes performance”Lists are kept as compact rows (the server’s cells, name, labels, owners;
no spec, status or annotations), read straight from the API’s pages into
them; a table builds only the rows on screen; filtering and sorting run
over the rows in memory on each keystroke. Measured on an M-series MacBook
against a litek8s API server with no nodes (litek8s apiserver --no-node)
holding 50, 1 000 and 5 000 pod objects (two containers each, 50
namespaces), both UIs on the pods of all namespaces in a 120x40 tmux
window, release build, k9s v0.50.16 (Homebrew), 60 s idle, RSS and CPU
time from ps (perf script: create the pods with the API, start the UI,
wait for the list, sample, filter, quit):
| pods | startup to the list | RSS | CPU idle | filter keystroke to screen | |
|---|---|---|---|---|---|
| 50 | litek8s ui | 0.09 s | 19.7 MiB | 0.00 % | 0.5 ms (25 ms on screen) |
| k9s | 1.87 s | 101.7 MiB | 0.40 % | (24 ms on screen) | |
| 1 000 | litek8s ui | 0.16 s | 29.4 MiB | 0.02 % | 0.6 ms (22 ms on screen) |
| k9s | 1.64 s | 153.9 MiB | 3.17 % | (23 ms on screen) | |
| 5 000 | litek8s ui | 0.83 s | 61.0 MiB | 0.02 % | 1.0 ms (30 ms on screen) |
| k9s | 3.05 s | 359.7 MiB | 15.4 % | (26 ms on screen) | |
| 5 000, 10 updates/s | litek8s ui | 1.23 s | 43.6 MiB | 1.28 % | 0.9 ms (26 ms on screen) |
| k9s | – | 361.3 MiB | 15.2 % | (38 ms on screen) |
- Startup is from starting the process to the full list on screen,
watched from outside every 10 ms (it includes
tmuxstarting it);LITEK8S_UI_STATS=1puts litek8s’s own figure at 45 ms, 112 ms and 788 ms (most of it the API server paging 5 000 pods). - Filter keystroke: the first figure is litek8s’s own, from the key to
the frame written (
LITEK8S_UI_STATS); in brackets, fromtmux send-keysto a changedtmux capture-pane, which cannot go below about 22 ms: both UIs are at that floor. - Idle: pods bound to a node that does not exist, so nothing changes. The last two rows are pods the server’s scheduler keeps retrying (about 10 pod updates a second at 5 000 pods): litek8s sends a table at most once a second while changes keep coming and redraws only then; k9s re-renders its tables every 2 s whether or not anything changed.
- Over SSH on omarchy (Linux x86_64, rootless dev cluster, pods table of a namespace with two running pods, 100x30): 0 CPU ticks in 60 s, 24 MiB RSS, 2 threads.
How it talks to litek8s
Section titled “How it talks to litek8s”Only through what litek8s already serves, so a remote litek8s looks the same:
| what | from |
|---|---|
| containers, images, volumes, sizes, logs, exec, prune | the Docker Engine API on the socket (GET /containers/json, /system/df, /events, POST /exec/{id}/start upgraded to a raw stream, …) |
| resource types | discovery: aggregated (/api, /apis as APIGroupDiscoveryList, two requests), else the legacy per-group documents |
| every list | ?limit=2000&includeObject=Metadata as a server-side Table (as=Table;g=meta.k8s.io), then a watch from its resourceVersion (Tables too) |
| describe, YAML, edit, delete, scale, rollouts, cordon, drain | GET, PUT (with ?dryRun=All first for edits), DELETE with propagationPolicy, PATCH .../scale, merge and JSON patches, POST .../eviction |
| logs | .../log?follow=true×tamps=true&tailLines=N per pod and container |
| shell | GET .../exec upgraded to a WebSocket (v5.channel.k8s.io, else v4.channel.k8s.io) |
| port-forward | POST .../pods/{name}/portforward upgraded to SPDY/3.1 (portforward.k8s.io), one session per local connection, listening on 127.0.0.1 |
| CPU and memory columns | metrics.k8s.io (when the cluster serves it), every 15 s while pods or nodes are shown |
:kubectl, plugins |
kubectl --context <the UI's context>, the plugin’s command, as child processes |
| state, CPU, memory, disk of the dev cluster | the dev supervisor’s state file (dev.json: mode, port, pid, cgroup or VM process, what it started with), its cgroup or the VM process |
| up, down, delete, new cluster | litek8s dev up/down/delete --name <cluster>, run as a child process (its output shows on Home and Clusters) |
| the local clusters, their memory | the clusters’ files in the dev data directory (cluster.json, dev.json), one request to the VM or sandbox (env.sock) for every cluster’s memory, GET /api/v1/nodes of each running one for its Ready nodes |
litek8s ui --docker-host tcp://10.0.0.5:2375 --context remote # another litek8slitek8s ui --docker-host unix:///run/user/1000/litek8s.sock # e.g. a socket forwarded with ssh -Llitek8s ui -n demo # start in a namespaceWithout flags the UI follows this machine’s dev cluster: the Kubernetes side uses the API port the running cluster recorded (and reconnects when it moves), and says “not running” rather than falling back to whatever listens on 6443.
Apps: Argo CD and litecd
Section titled “Apps: Argo CD and litecd”View 0 shows up on clusters that serve Argo CD’s Application CRD
(applications.argoproj.io), whoever reconciles it: Argo CD, or
litecd, which reads and writes
the same objects. It replaces the basics of Argo CD’s web UI with nothing
but the Kubernetes API: the list, an app’s resources and history, and the
actions, which patch the Application the way the argocd CLI does, so they
work for either controller and need neither’s API server nor a login.
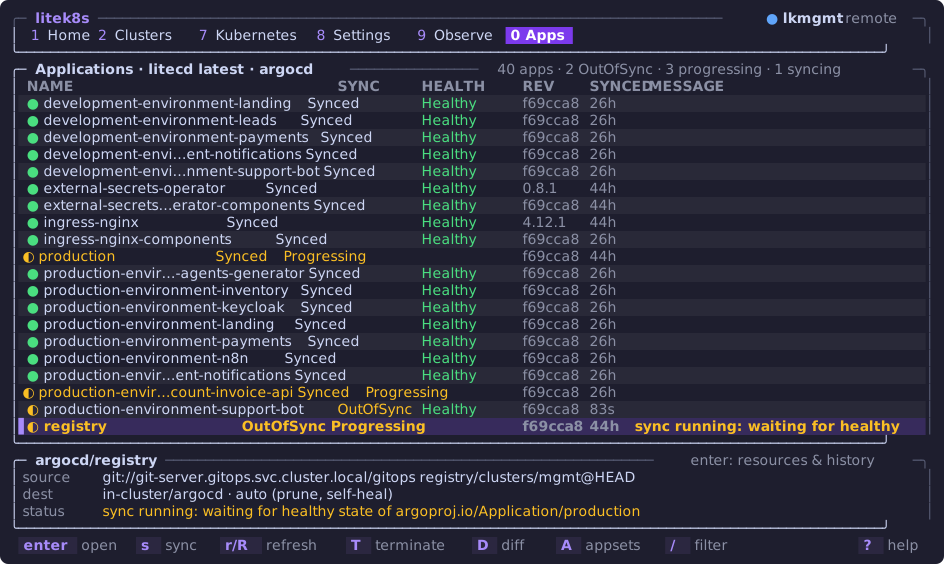
litek8s 1 Home 2 Clust 7 Kube 8 Set 9 Obs 0 Apps ● lkmgmt · remote╭─ Applications · litecd latest · argocd ────────────── 40 apps · 2 OutOfSync ─╮│ NAME SYNC HEALTH REV SYNCED MESSAGE ││▌● argo Synced Healthy 0.20.1 5h ││ ● cert-manager Synced Healthy v1.14.4 23h ││ ◐ development Synced Progressing f69cca8 23h ││ ● developme…nt-groveback Synced Healthy f69cca8 5h ││ ◐ production-env…ifybot OutOfSync Healthy f69cca8 3m ││ ◐ registry OutOfSync Progressing f69cca8 23h sync running…││ ✕ web OutOfSync Degraded 0123456 9m sync failed:…│╰──────────────────────────────────────────────────────────────────────────────╯╭─ argocd/argo ─────────────────────────────────── enter: resources & history ─╮│ source https://argoproj.github.io/argo-helm argo-workflows@0.20.1 ││ dest in-cluster/argo · auto (prune, self-heal) ││ status Synced · Healthy compared 11s ago │╰──────────────────────────────────────────────────────────────────────────────╯ enter open s sync r/R refresh T terminate D diff A appsets ? help- The list: every Application of every namespace, by name. The glyph
is health and sync together (
✕Degraded,◐Progressing, Missing, out of sync or syncing,●Synced and Healthy);REVthe revision it is synced to (a commit’s first 7 characters, a chart’s version),SYNCEDwhen its last operation ended (else the last deploy in its history), and the message of a running or failed operation, else its first condition, else its health message. The title says which controller runs them (the Deployment or StatefulSet in the apps’ controller namespace: litecd, or Argo CD’s application controller, with its image’s tag); the right side counts the apps, degraded, out of sync, progressing and syncing. Under the list, the selected app’s source(s), destination and sync policy. Wide terminals (140 columns) add the project and a short source./filters by name, namespace, project, sync or health (/OutOfSync). Aswitches to the ApplicationSets (when there are any): their generators, how many apps each owns, and an error condition if one is set.enteropens the app: its source(s), destination, project and policy, the revision, when it synced and was last compared, the operation (phase, who started it, its message), the health message and conditions; under it the resources of its status with their sync and health (requires pruning, hooks). Argo CD v3 leaves the resources’ health out of the status (resourceHealthSource: appTree); there it is read from the live objects (as the Kubernetes view’s tree does) while the app is open, and child Applications (app of apps) get their own status’s health.hcycles the list between resources, the sync history (newest first: id, revision, when, by whom orauto, source) and the last sync result (each resource’s result and message).enteron a resource describes it in the Kubernetes view;escthere comes back.Dthe diff with git (the published diff Secret litecd writes; Argo CD keeps its own in argocd-server),dthe Application described, both in the Kubernetes view;esccomes back.
Actions, on the selected app (list) or the open one:
| key | does |
|---|---|
s |
sync: a dialog says what it does; p turns on prune (deletes what git no longer has), f force (deletes and recreates what cannot be patched, as argocd app sync --force); y writes the operation the argocd CLI writes (the app’s sync options, the hook strategy, prune, hook.force), n/esc cancels. Refused while another operation runs. force is Argo CD only: litecd has no force sync, so the dialog leaves it out there |
r / R |
refresh / hard refresh: the argocd.argoproj.io/refresh annotation (normal, hard: render the manifests again) |
T |
terminate the running sync (as argocd app terminate-op: its phase to Terminating), after asking; only while one runs. Argo CD only: litecd cannot terminate a sync, and the view says so |
They are changes, so they follow the Kubernetes view’s rule: allowed on
litek8s clusters, refused (and the footer says why) on other contexts
unless W or writableContexts allows them, and everywhere with
readOnly: true. The view lists /apis/argoproj.io/v1alpha1/applications
and .../applicationsets every 5 s while it is on screen and not at all
otherwise (once more right after an action); the controller is looked up
once per cluster (list on Deployments and StatefulSets of its namespace;
without that permission it says controller unknown). On a cluster
without the CRD the tab is not there and 0 says why.
Light on the machine
Section titled “Light on the machine”The UI draws only when a key, a window resize or new data changes what is on screen, and waits on sockets otherwise:
- No polling for lists. Containers, images and volumes are re-listed
only after Docker events (
GET /events), coalesced over 150 ms; sizes (/system/df, which walks directories) only after events that change them and at most every 2 s. Compose projects’ use against their budgets is the exception: every 2 s while Containers is on screen, never otherwise. Pods, deployments and namespaces come from Kubernetes watches, coalesced over 100 ms. - Clusters lists the clusters every 2 s while the view is on screen (their files, one memory request to the VM or sandbox, a node list from each running cluster) and not at all otherwise: a cluster nobody looks at is not polled.
- Home’s breakdowns come with its samples: memory and CPU counters every 2 s while Home is on screen (on the Mac one request over the VM’s control channel), the disk categories every 30 s from a walk the API server repeats at most once a minute; nothing while Home is hidden. Measured on omarchy, Home with the CPU box over a busy pod: 0.08 % CPU, 1.8 wake-ups/s, 18 MiB RSS.
- Home samples the shown cluster’s state, CPU and memory every 2 s while Home or Free space is on screen, every 10 s on Settings (for its restart note), every 60 s otherwise (to notice the API port moving); the data directory’s size (a directory walk) at most every 30 s and only while it is shown. When the engine is down it is retried with backoff up to 10 s.
- The look adds no timer: Home’s history graphs are filled by its own 2 s samples while it is on screen, and the terminal’s background is asked once, before the first frame (see Look).
- Input comes from crossterm’s event stream, which waits in the terminal reader (no timer); while a shell or an editor has the terminal the stream is dropped, so nothing else reads keystrokes. The only timers are a status message fading after 8 s and, on the views that show ages, a redraw every 30 s.
- Two threads:
litek8s uiruns on a single-threaded async runtime (the servers in the same binary use one thread per core) plus crossterm’s terminal reader; a blocking-pool thread comes and goes for the data directory walk. The log view keeps the last 5000 lines, each cut at 4096 characters.
Measured on Linux x86_64 (omarchy, release build, rootless dev cluster with
a 3-container compose project and a 3-replica deployment, 80x24 in tmux,
after two window resizes), idle 60 s in each view; CPU from
/proc/<pid>/stat, wake-ups are voluntary context switches of all its
threads:
| view | CPU | wake-ups | RSS | threads |
|---|---|---|---|---|
| Home (samples every 2 s) | 0.07 % | 3.6/s | 16.5 MiB | 3 (the size walk’s blocking thread) |
| Clusters (2 clusters, one with 3 nodes; every 2 s) | 0.08 % | 2.3/s | 17.3 MiB | 2 |
| Containers | 0.00 % | 0.3/s | 16.5 MiB | 2 |
| Kubernetes | 0.02 % | 0.4/s | 16.5 MiB | 2 |
| Settings | 0.02 % | 1.0/s | 16.6 MiB | 2 |
| a log following 1 line/s | 0.03 % | 2.4/s | 19.1 MiB (peak) | 2 |
(The Clusters row is from a later round with named clusters, same machine and method; in that round Home measured 0.03 % and 1.8/s, Containers 0.00 % and 0.1/s: with Clusters off screen, nothing samples the clusters.)
On macOS (M-series MacBook, litek8s dev up --cpus 4 --memory 4096, the
same workload, 80x24 in tmux), idle 60 s in each view; CPU from ps
CPU time, idle wake-ups and footprint (what Activity Monitor calls Memory)
from top:
| view | CPU | idle wake-ups | footprint | RSS | threads |
|---|---|---|---|---|---|
| Home (samples every 2 s) | 0.12 % | 0.02/s | 6.5 MiB | 20.2 MiB | 3 |
| Containers | 0.00 % | 0.02/s | 6.5 MiB | 20.2 MiB | 2 |
| Kubernetes | 0.02 % | 0.02/s | 6.5 MiB | 20.2 MiB | 2 |
| Settings | 0.02 % | 0.02/s | 6.5 MiB | 20.2 MiB | 2 |
| a log following 1 line/s | 0.07 % | 0.03/s | 6.6 MiB | 20.2 MiB | 2 |
(RSS counts the shared pages of the 39 MB binary; the footprint is the UI’s own memory.)
Startup: on Linux the first frame is drawn 0.7 ms after the UI starts and
the first one with the engine’s containers 2.7 ms after; on the Mac 1.6-2.8
ms and 7-13 ms (the Docker socket is relayed into the VM over vsock).
LITEK8S_UI_STATS=1 litek8s ui prints these, and the number of frames
drawn, when it exits: 156 frames in 315 s for the Linux run above, nearly
all of them Home samples and log lines.
Size: the UI (ratatui and crossterm, no other new dependency) adds to the release binary:
| main (c47079e) | with the UI | delta | |
|---|---|---|---|
| macOS arm64, stripped | 30.86 MB | 32.43 MB | +1.49 MiB |
| macOS arm64, as built | 37.39 MB | 39.28 MB | +1.80 MiB |
| Linux x86_64, stripped | 35.95 MB | 37.63 MB | +1.61 MiB |
| Linux x86_64, as built (with symbols) | 45.49 MB | 47.65 MB | +2.06 MiB |
Most of it is the UI’s own code (about 650 KiB of symbols); ratatui and crossterm are about 200 KiB.
The Kubernetes view’s cluster UI (src/ui/kube) adds 1.92 MiB more to the stripped macOS arm64 binary (33.41 MB on main c620693, 35.43 MB with it; 40.37 → 42.76 MB as built), with no new dependency. The look (src/ui/theme.rs) adds 70 KiB on macOS and 12 KiB on Linux.
| where | keys |
|---|---|
| everywhere | 1-9, 0/tab/shift-tab views, ↑↓/jk/PgUp/PgDn/g/G move, / filter the list (esc clears), ctrl-r refresh, ? help, q or ctrl-c quit |
| Home | u up, d down (asks), R delete the cluster (asks), b the next breakdown (memory, CPU, disk), c copy the API address |
| Clusters | n new (tab between name and nodes), u up, d down (asks), D/del delete (asks), enter show it (a local cluster: every view, then asks about kubectl/docker; another context: the Kubernetes view), t straight into its tree, c copy its context name |
| Containers | l/enter logs, s shell, u start, x stop (asks), r restart (asks), d/del remove (asks), space fold a project |
| Images, Volumes | d/del remove (asks) |
| Free space | space select a category, p/enter free the selected (asks) |
| Kubernetes | see its keys; ? there lists the ones of what is shown |
| Settings | enter edit, del back to the default, space toggle / switch a context |
| Observe | l/enter the pod’s logs, L search every pod’s logs, s sort by CPU/memory, n/N namespace, a acknowledge the pod’s alerts, A all (asks) |
| Apps | enter open the app (esc back), h resources / sync history / last result, s sync (p prune, f force; asks), r/R refresh / hard refresh, T terminate the sync (asks), D diff, d describe, A ApplicationSets; on a resource enter describes it |
| logs | f follow, w wrap, c clear, esc back |
--mouse turns on clicks (tabs, rows) and the wheel; it is off by default
because it takes over the terminal’s own text selection.
Copying: c puts the shown text on the clipboard (OSC 52, which reaches
terminals over SSH and tmux, and pbcopy on a Mac); in the Kubernetes view
c copies a name and C a YAML. The terminal’s own selection works too, but
the screen redraws every 2 s, which can clear it in some terminals; on macOS,
option-drag selects even with --mouse.
Limits
Section titled “Limits”- Describe is kubectl’s for pods, deployments, nodes and services, and its generic form (fields as “Title Case” keys) for every other type.
- Rollout undo and history are for deployments (StatefulSets’ and DaemonSets’ ControllerRevisions are not read).
- With
publish: allthe ports listen on every interface, butdocker psstill shows them as127.0.0.1:<port>: the engine in the VM or sandbox does not know where the host side listens. - Exec credential plugins that return client certificates (rather than a
token) are not supported;
auth-provideronly with a token in the kubeconfig (OIDC’sid-token).